Rolling Resistance: Illustrative Plots
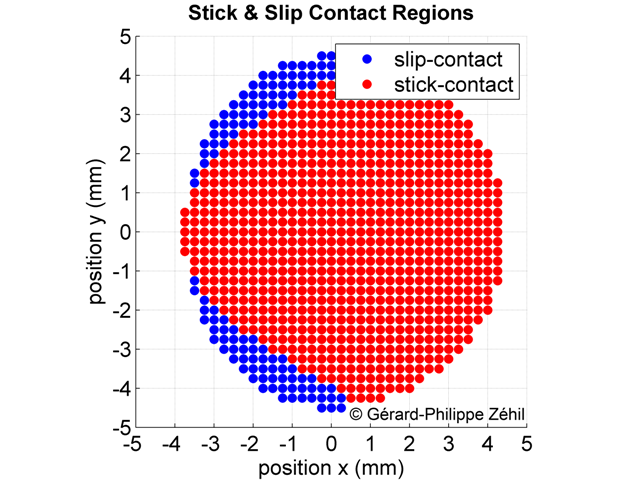
Figure 1 shows the shape of the contact surface between a rigid sphere and a viscoelastic layer on which the sphere is rolling at constant speed, in direction x. Slipping occurs in the region displayed in blue, as opposed to the region in red where the sphere sticks to the layer's upper boundary.
 |
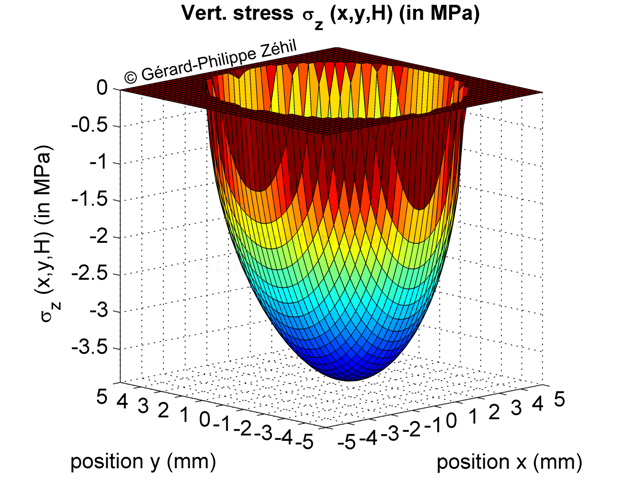 |
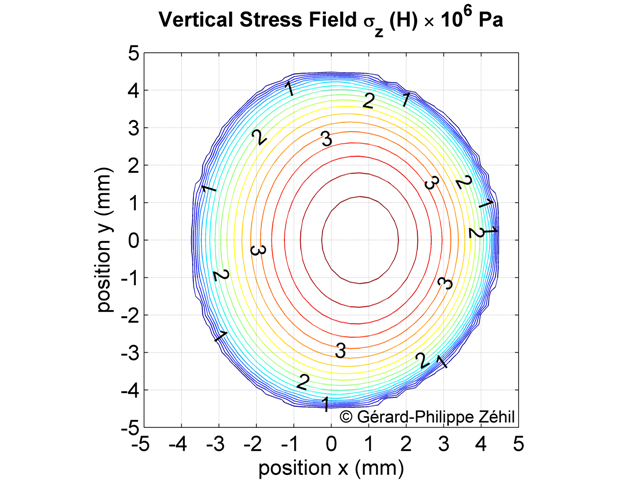
Figure 2 shows a 3D plot and a contour plot of the vertical contact stress distribution across the candidate contact surface. This distribution is asymmetrical due to the viscoelastic nature of the layer. The resultant force is shifted in the direction of movement, which generates a torque resisting motion.
 |
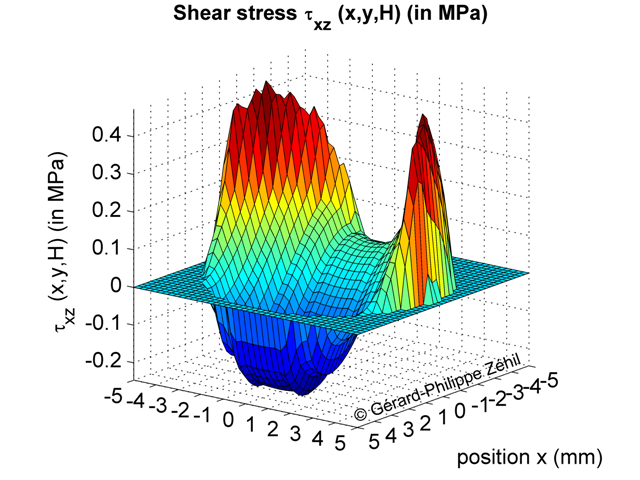 |
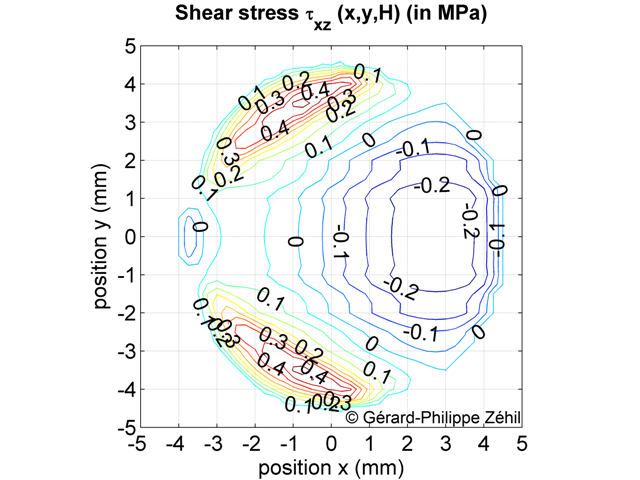
Figure 3 shows a 3D plot and a contour plot of the horizontal contact stress distribution across the candidate contact surface, in direction x (i.e. along the direction of motion). In the front part of the stick-contact zone, the rolling sphere mainly shears the layer backwards, as evidenced by the negative sign of the stress. In the slip-contact zones, the sphere shears the layer forwards as it is slipping in the direction of motion.
 |
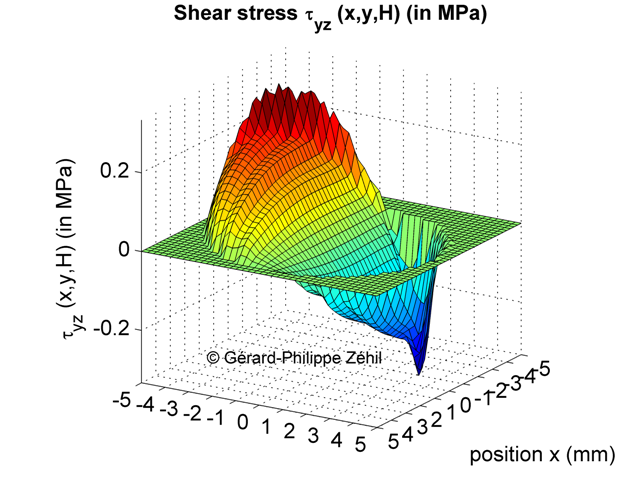 |
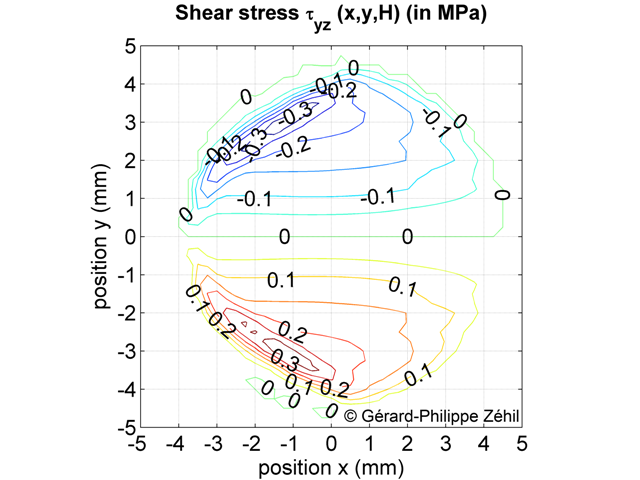
Figure 4 shows a 3D plot and a contour plot of the horizontal contact stress distribution across the candidate contact surface, in direction y (i.e. perpendicular to the direction of motion). As it is indenting the layer, the incoming sphere pushes the deformable continuum (in the bulk) away from the axis of motion. The upper boundary of the layer is however retained by its surface interactions with the sphere. As a result, the sphere shears the layer across the contact surface towards the line of motion.
 |
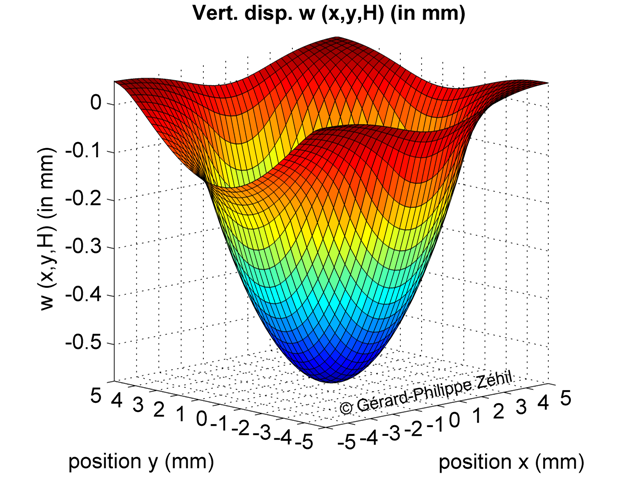 |
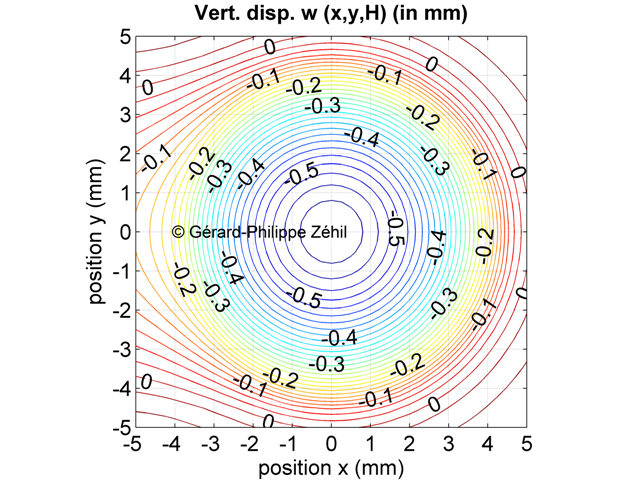
Figure 5 shows a 3D plot and a contour plot of the vertical displacement field across the candidate contact surface. The asymmetry of the field is due to viscoelasticity. The continuum `builds-up' in front of the sphere causing the layer's boundary to rises higher than it does at the back of the sphere.
 |
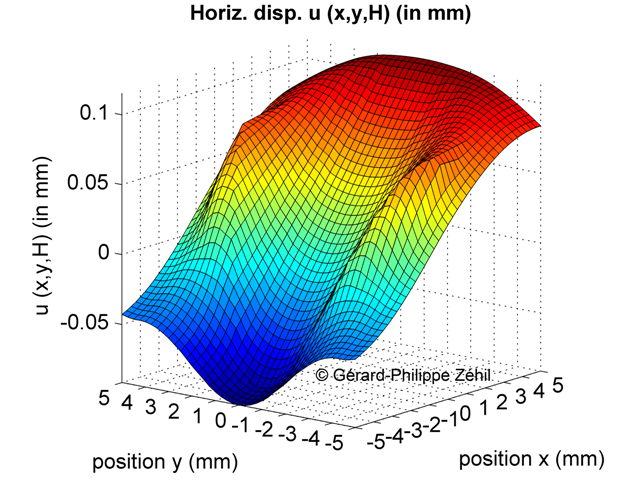 |
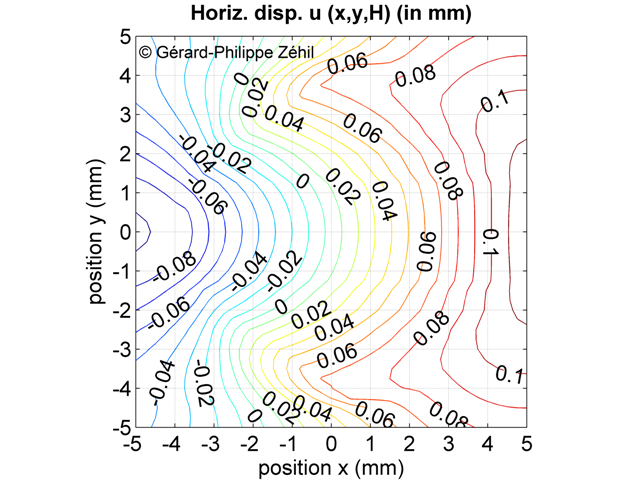
Figure 6 shows a 3D plot and a contour plot of the longitudinal displacement field, across the candidate contact surface. For an observer translating with the sphere, the layer's upper boundary appears to be: (i) displaced forward across the front part of the contact zone as well as in front of the sphere, and (ii) displaced backward across the rear portion of the contact zone as well as behind the sphere.
 |
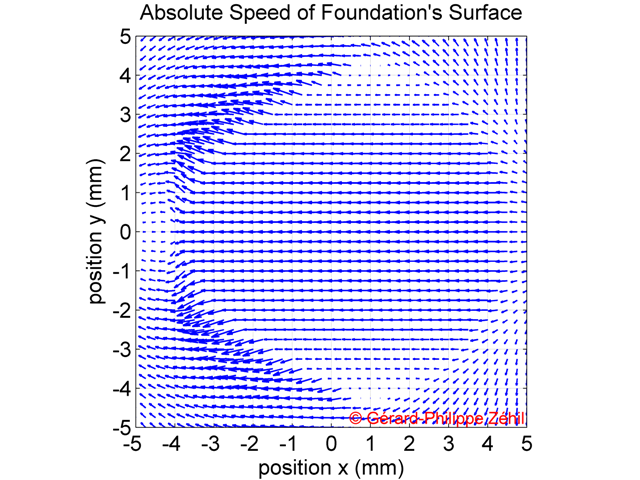 |
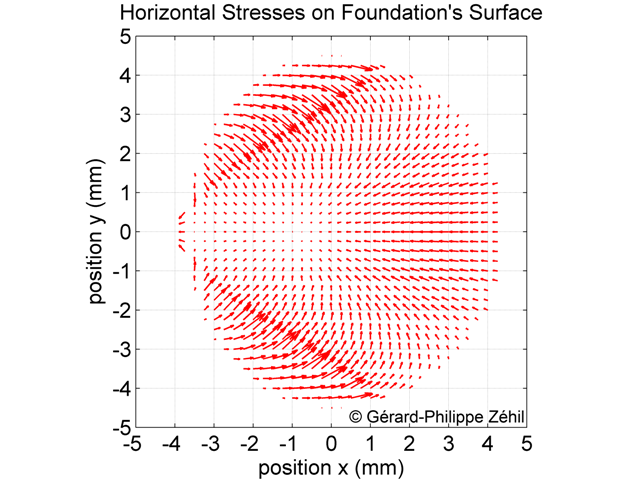
Figure 7 shows quiver plots of: (i - red arrows) the horizontal stress field across the contact surface, acting on the layer's upper boundary, and (ii - blue arrows) the horizontal projection of the absolute velocity field across the surface.
